Analyze your documents with the Analysis Agent
What Is the Analysis Agent?
The Analysis Agent is a feature that uses artificial intelligence to examine files in different formats, analyze the data they contain, and generate results in various output formats.
Users can ask questions about uploaded files and create summaries, tables, comparisons, charts, reports, or presentations without writing code, formulas, or performing technical operations.
The Analysis Agent is particularly useful for reviewing and analyzing large Excel files. Processing time and the amount of data that can be analyzed may vary depending on the file structure and available system resources.
Supported File Types
The following file types can be added to the Analysis Agent:
| File type | Supported extensions |
|---|---|
| Text-based data files | .csv, .tsv |
| Excel files | .xlsx, .xls, .xlsm |
| Structured data files | .json |
| PDF documents | .pdf |
| Word documents | .docx |
Supported Output Types
Analysis results can be generated in the following formats:
- Excel
- HTML
- PowerPoint (
.pptx)
How to Use the Analysis Agent
1. Open the Analysis Agent
Click the Tools icon next to the message field on the chat screen.
Select Analysis Agent from the list that opens.
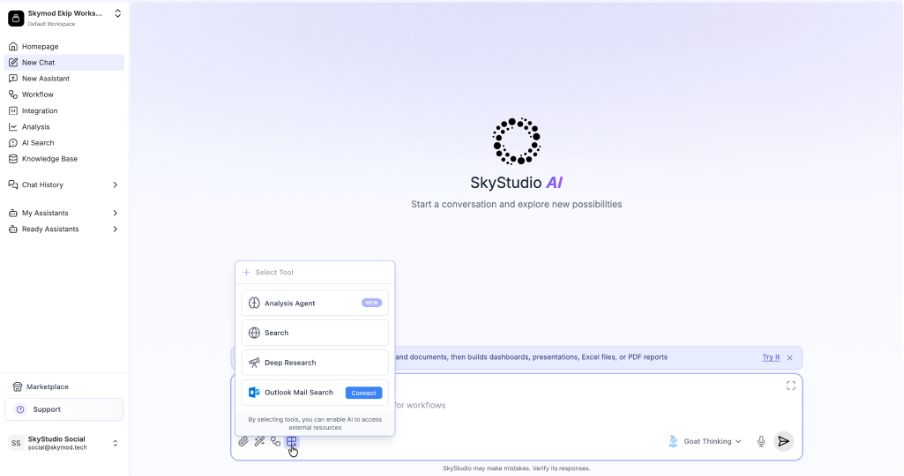
You can start a new analysis or continue working on a previously created analysis.
2. Add Your Files
After selecting the Analysis Agent, click the + icon next to the message field.
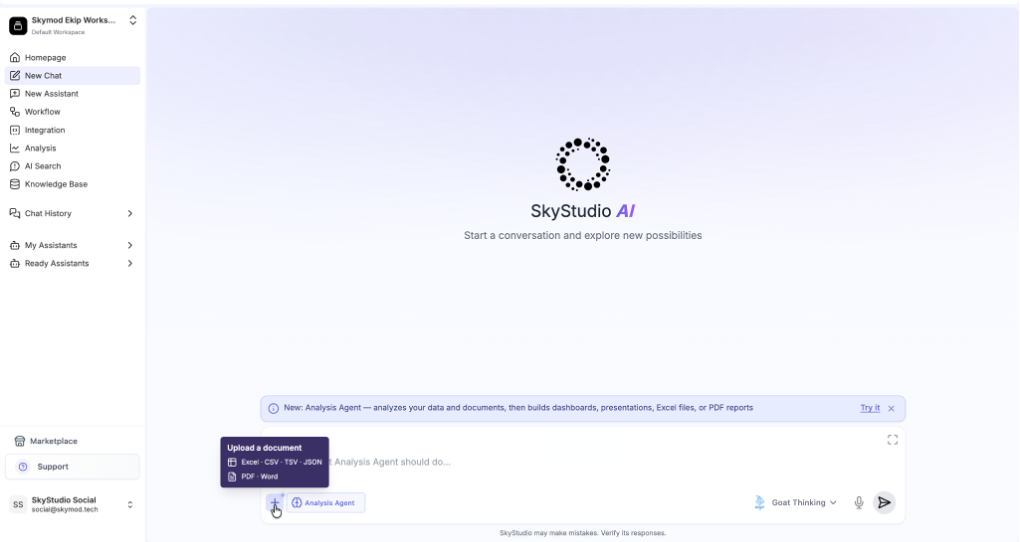
Use the file attachment option to select the files you want to analyze.
The Analysis Agent supports the following file types:
- CSV
- TSV
- XLSX
- XLS
- XLSM
- JSON
- DOCX
Once the files have been added, their names will appear on the chat screen.
File attachment limits: There is no predefined limit on the number of files that can be added to the Analysis Agent. Although no fixed file size limit is specified, the time required to add and analyze large files may vary depending on the file structure and available system resources.
Tip: Large Excel files can be added directly. Analysis time may vary depending on the file structure and the amount of data it contains.
3. Describe the Task You Want to Perform
After adding the files, enter a clear and specific description of the task in the message field.
Example requests
- “Analyze the sales data in this file.”
- “Calculate total sales by month.”
- “Identify the five best-selling products.”
- “Find missing or incorrect records.”
- “Summarize this document.”
- “Convert the information in this file into a comparative table.”
- “Visualize sales trends using charts.”
- “Create an executive summary based on this data.”
The more detailed the request, the more closely the Analysis Agent can tailor the result to your requirements.
4. Review the Analysis Results
After the request is submitted, the Analysis Agent examines the added files and displays the results on the screen.
The generated output may include:
- Data summaries
- Calculations
- Comparisons
- Tables
- Charts
- Trend analyses
- Identification of missing or inconsistent data
- Document summaries
- Report content
- Presentation content
If the initial result does not fully meet your needs, you can provide additional instructions within the same analysis.
Example follow-up instructions
- “Separate the results by region.”
- “Use only records from 2026.”
- “Add a percentage change column to the table.”
- “Use more descriptive titles for the charts.”
- “Make the report shorter and more suitable for an executive presentation.”
As long as you continue within the same analysis, you do not need to add the files again.
Creating Output Files
Once the analysis is complete, specify the desired output format in your message to receive the result as a file.
The Analysis Agent supports the following output types:
- Excel
- HTML
- PowerPoint
Creating an Excel Output
Excel output can be used when you want to organize data in tables, retain calculations, or edit the results later.
Example request
“Create an Excel file containing the analysis results. Include a summary on the first sheet, detailed data on the second sheet, and charts on the third sheet.”
The Analysis Agent creates an Excel file based on the instructions provided.
Creating a PDF Output
PDF output can be used to prepare a shareable report with a consistent layout.
Example request
“Create a professional PDF report containing headings, tables, and charts based on this analysis.”
You can also specify the target audience:
“Prepare the report for presentation to senior management.”
Creating an HTML Output
HTML output can be used to view the results in a web browser or publish them as a web-based report.
Example request
“Create an HTML report containing headings, tables, and charts based on the analysis results.”
Creating a PowerPoint Output
PowerPoint output can be used to present the analysis results in presentation format.
Example request
“Create an eight-slide PowerPoint presentation based on this data. Include an executive summary, key findings, charts, and a conclusion.”
To create a presentation that better matches your needs, you may also specify:
- Target audience
- Number of slides
- Presentation language
- Required headings
- Level of detail
- Chart or table preferences
Example Use Cases
Analyzing Sales Data
Add an Excel or CSV file and provide the following instruction:
“Analyze sales by month, product, and region. Identify the highest- and lowest-performing products. Create an Excel file containing the results and supporting charts.”
Reviewing Survey Results
Add a CSV, TSV, or Excel file and provide the following instruction:
“Analyze the survey responses. Calculate satisfaction rates, identify the most common responses, and prepare the results as a PDF report.”
Creating a Financial Report
Add an Excel file and provide the following instruction:
“Compare income and expenses by month. Calculate profitability ratios, explain significant changes, and create a PowerPoint presentation suitable for management.”
Summarizing a PDF or Word Document
Add a PDF or Word document and provide the following instruction:
“Review this document. Create a PDF report summarizing the main headings, key decisions, risks, and required actions.”
Converting JSON Data into a Table
Add a JSON file and provide the following instruction:
“Convert the records in the JSON file into a table. Group the data by category and create an Excel file.”
Comparing Multiple Files
Add multiple supported files and provide the following instruction:
“Compare the data in the files I added. Identify matching and differing records, calculate percentage changes, and create a comparative Excel report.”
Analyzing Large Excel Files
Add a large Excel file and provide the following instruction:
“Analyze the data in this Excel file. Consider all accessible records and create a summary report.”
Recommendations for Better Results
Write Clear Instructions
Instead of providing a general instruction, describe the task in detail.
General request:
“Analyze this file.”
More specific request:
“Group sales by month, calculate the percentage change compared with the previous month, and list the products with the highest growth.”
Specify the Fields to Be Used
If the file contains many columns or sections, clearly identify which fields should be included in the analysis.
Example
“Use the Date, Product, Region, Sales Quantity, and Total Amount columns in the analysis.”
Define Filters
If only a specific period, category, or group of records should be reviewed, include this information in your request.
Example
“Analyze only records from January to June 2026.”
Specify the Target Audience
You can indicate who will use the report or presentation.
Example
“Prepare the report for senior management without including technical details.”
Describe the Output Structure
You can define the structure of the output file in advance.
Example
“Create three separate Excel sheets named Summary, Detailed Data, and Charts.”
File Preparation Recommendations
For more accurate results, particularly when working with Excel, CSV, and TSV files, consider the following recommendations:
- Use a clear heading for each column.
- Use the same data type consistently within each column whenever possible.
- Remove empty rows and unnecessary heading areas.
- Avoid merged cells whenever possible.
- Use a consistent format for date fields.
- Do not store numeric values as text.
- Standardize different labels that refer to the same information.
- Keep tables in Excel files structured and continuous.
Common Issues
The File Cannot Be Added
Check the following:
- Confirm that the file extension is supported.
- Ensure that the file is not corrupted or password-protected.
- Confirm that the Analysis Agent option is active.
- Make sure the file is added using the + icon next to the message field.
- Refresh the page and try adding the file again.
The Analysis Does Not Produce the Expected Result
Provide more detailed instructions.
Insufficient request:
“Review the sales.”
More specific request:
“Group the 2026 sales data by month. Calculate total sales amount, average order value, and the percentage change compared with the previous month.”
Incorrect Columns Are Used
Clearly specify which columns should be included in the analysis.
Example
“Use only the Date, Region, and Net Sales columns. Ignore the Description column.”
The Output Format Is Different from the Expected Format
Specify both the required file format and the expected content.
Example
“Create the result as an editable Excel file rather than a PDF. Place the calculations and charts on separate sheets.”
The Generated File Needs to Be Updated
Instead of starting over, request the required changes within the same analysis.
Example
“Add data labels to the charts in the Excel file you created and display monthly totals on a separate sheet.”
Comprehensive Example Request
The following example covers both file analysis and output creation in a single instruction:
“Analyze the sales file I added. Group the data by month, region, and product category. Calculate total sales amount, sales quantity, average order value, and monthly percentage change. Identify the five highest- and lowest-performing products. Display missing or inconsistent records in a separate table. Create an Excel file with four sheets named Summary, Detailed Analysis, Data Issues, and Charts.”
Usage Summary
- Click the Tools icon on the chat screen.
- Select Analysis Agent.
- Click the + icon next to the message field.
- Add the files you want to analyze.
- Enter the analysis request.
- Review the generated result.
- Refine the result with additional instructions when necessary.
- Select Excel, PDF, HTML, or PowerPoint as the output format.
- Open or download the file generated by the Analysis Agent.